Want to keep your mobile app fast, reliable, and scalable? These 5 monitoring tools can help you avoid crashes, reduce downtime, and improve user experience. Here’s the quick list:
- Datadog Mobile Monitoring: Real-time insights into app performance and user behavior.
- New Relic Mobile RUM: Tracks real user interactions for better troubleshooting.
- Sentry Mobile Error Tracking: Detects and categorizes errors with actionable insights.
- Dynatrace Automatic Cloud Orchestration: AI-driven monitoring with proactive issue prevention.
- Raygun Anomaly Detection: Real-time anomaly detection for crash-free apps.
Why Monitoring Matters:
- 47% of users abandon apps that take too long to load.
- Crashes cause 20% of app uninstalls.
- Monitoring reduces downtime and boosts performance, ensuring user satisfaction.
Quick Comparison:
| Tool | Setup Complexity | Best For | Scalability Features | Starting Price |
|---|---|---|---|---|
| Datadog | Medium | Full-stack monitoring | Auto-scaling dashboards | $15/host/month |
| New Relic | Medium | Real user experience tracking | Dynamic baseline alerts | $25/100GB/month |
| Sentry | Low | Crash detection and analysis | Custom workflows, release tracking | $26/month (team plan) |
| Dynatrace | Low | AI-driven automation | Cloud-native scaling | $69/month (8GB host) |
| Raygun | Low | Anomaly detection | Custom alert thresholds | $4/month (10K events) |
Start with crash reporting and user experience tracking, then expand to advanced tools as your app grows. These tools ensure your app stays fast, reliable, and ready to scale.
Automated Mobile App Performance Monitoring: Key Metrics for Android/iOS at MakeMyTrip
1. Datadog Mobile Monitoring
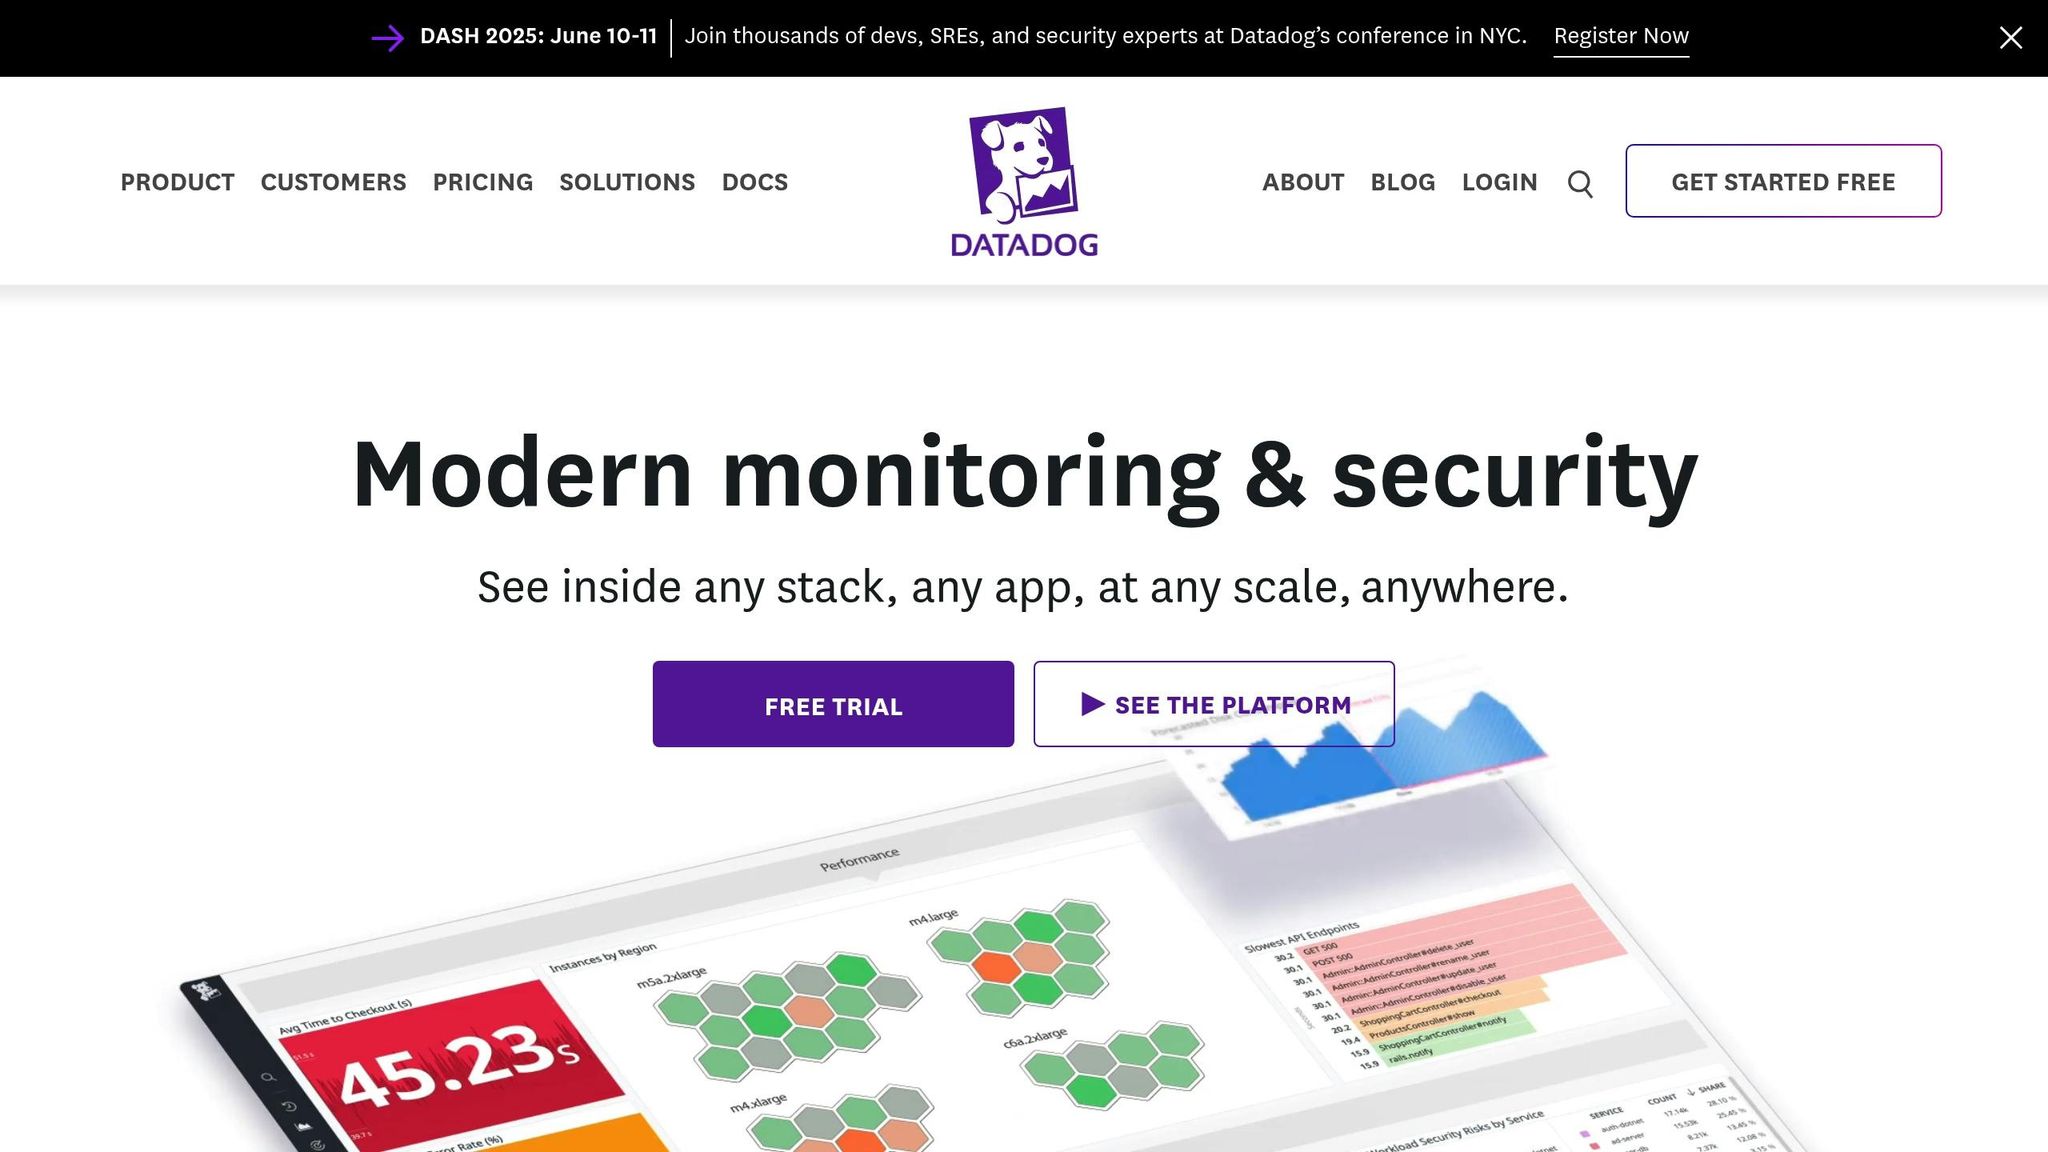
Datadog Mobile Monitoring provides a robust solution for understanding app performance and user behavior. With its ability to deliver real-time insights, the platform ensures you have a clear view of your mobile app’s health at all times. This makes Datadog an essential tool for monitoring mobile apps, especially in fast-paced, high-growth environments.
Real-time Monitoring Capabilities
Datadog excels at tracking critical performance metrics like load times, crashes, and dependencies in real time. By tying user experience data to business metrics, it offers a complete picture of app performance. Its Real User Monitoring (RUM) feature goes a step further by assigning health scores to services based on key indicators such as request rate, error rate, and latency. Tom Hayman, Head of Platform Engineering at Dunelm, highlights the benefits:
"Datadog RUM gives our teams visibility into every step of the customer journey on our E-commerce platform. RUM also enables us to quickly identify frontend issues, pinpoint impacted customers, and resolve errors so we can deliver a better user experience."
Scalability for Large User Bases
Scaling monitoring systems can become a headache as user numbers grow, but Datadog simplifies this process. It offers a unified platform that grows alongside your app, seamlessly integrating with cloud services and databases. Mark Chadwick, CIO & Co-Founder at Vistar Media, emphasizes this advantage:
"We are not running a metrics business over here so if I can get the monitoring out of my hands, I’m happy."
Integration with Mobile and Cloud Ecosystems
With support for over 600 technologies – including major cloud providers like AWS, Azure, and Google Cloud – Datadog delivers powerful monitoring capabilities. It also supports leading mobile platforms like Android and iOS, ensuring compatibility across environments. By connecting user journeys with synthetic tests, backend metrics, traces, and logs, Datadog helps teams uncover not just what is happening, but why. Blaine Schanfeldt, Site Reliability Engineer at Instacart, shares how this has transformed their processes:
"We have much better information than we ever had before. We can see not just how many requests failed, but how many users started the checkout process and experienced that failure. That was the big game changer here."
Proactive Issue Detection and Prevention
Datadog doesn’t just react to problems – it works to prevent them. By monitoring metrics like app start time, slow renders, and network performance, the platform helps identify potential issues before they impact users. When problems do arise, Datadog provides context by linking errors to user metadata, actions, and telemetry, enabling faster diagnosis. This proactive approach is critical, as crashes account for roughly 20% of mobile app uninstalls. Alex Aitken, Director of SRE and DevOps at Apixio, explains their approach:
"We first assess where the error is coming from using RUM dashboards. If users from a single office see slowdowns – but there are no errors on Apixio’s backend – we notify the customer IT department that the issues stem from their side, without escalating to the Engineering or DevOps teams."
Datadog’s leadership in the field is further validated by its recognition as a Leader in the Gartner Magic Quadrant™ for Digital Experience Monitoring and in The Forrester Wave™: AIOps Platforms .
2. New Relic Mobile Real User Monitoring (RUM)
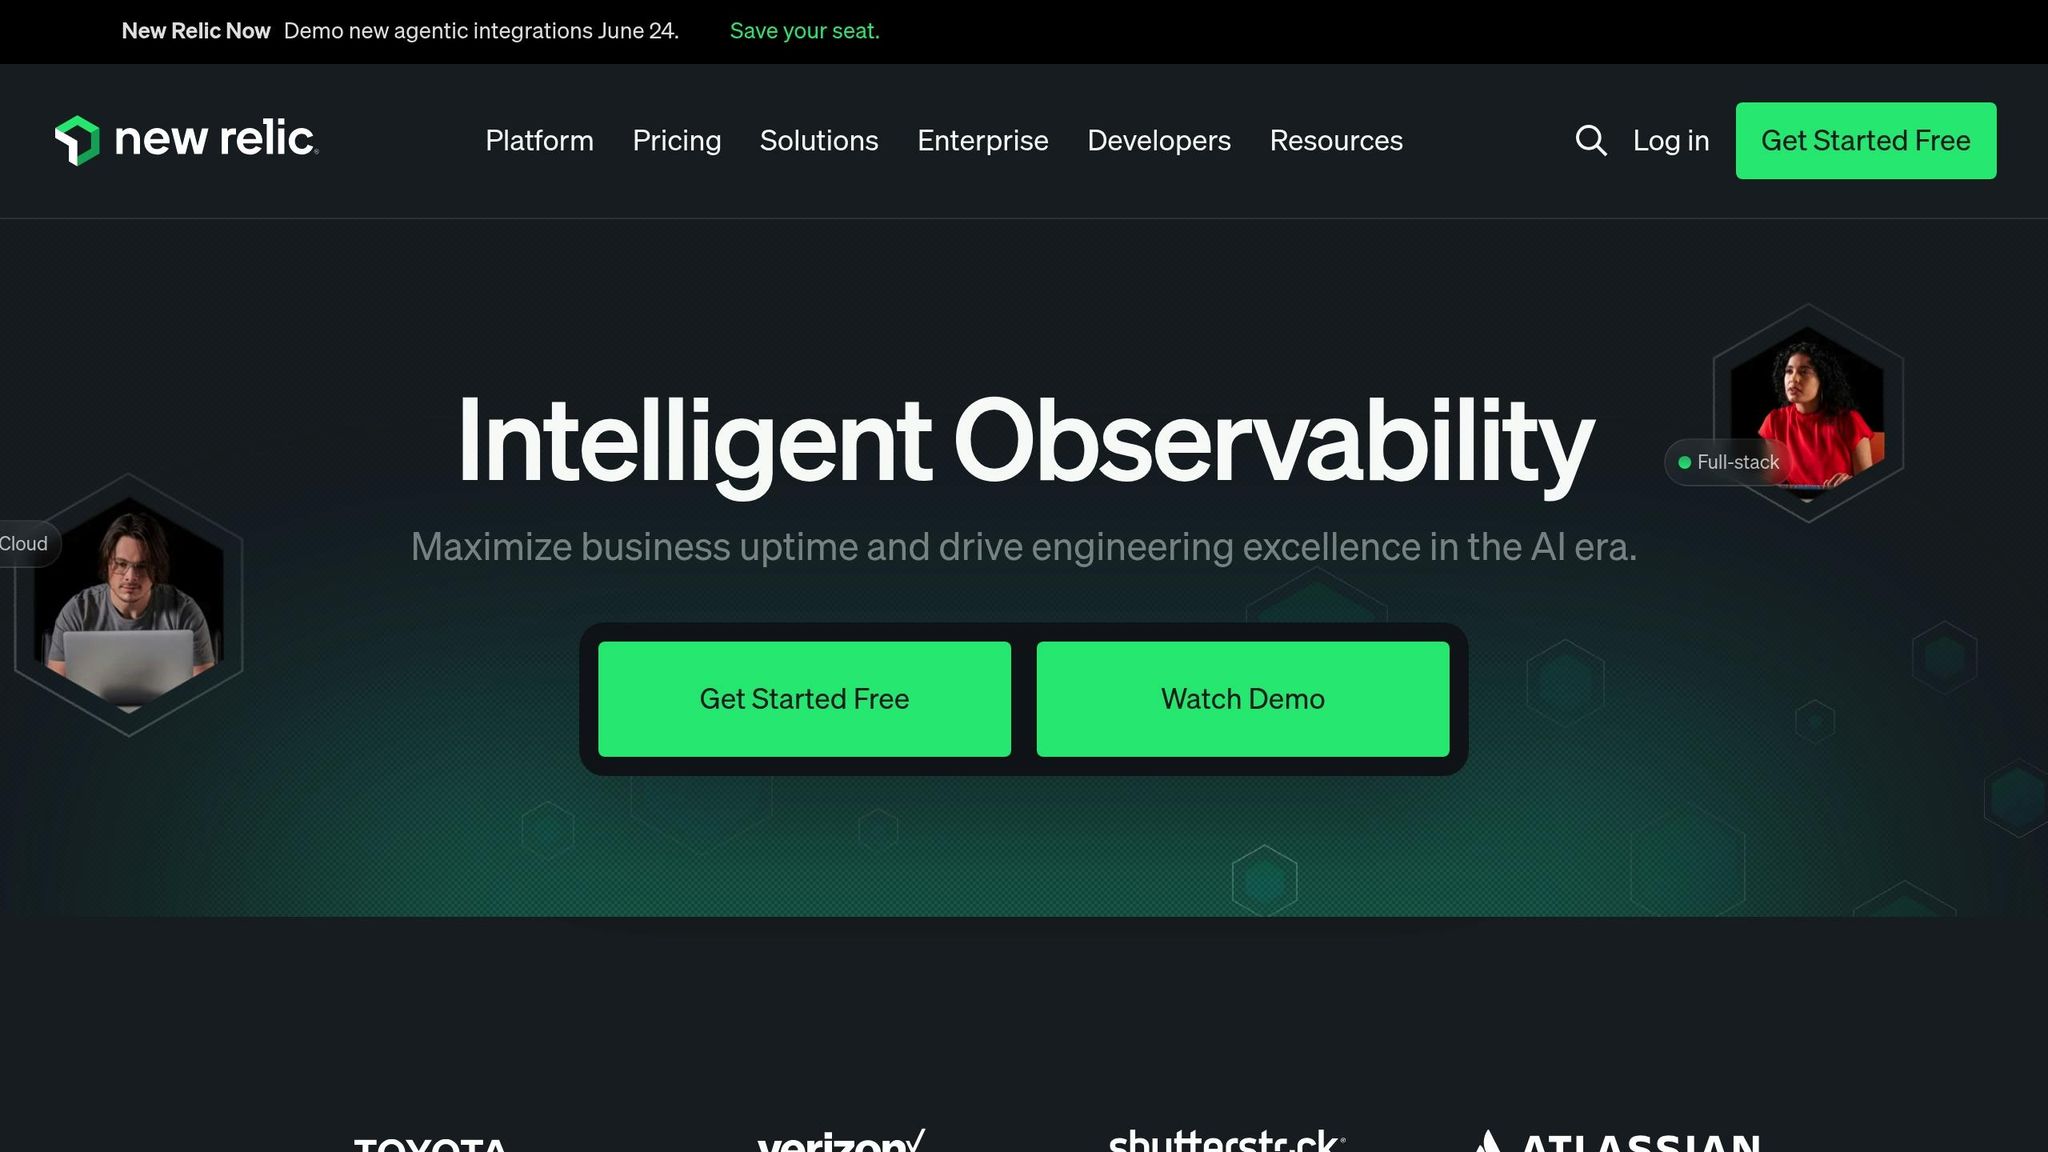
New Relic Mobile Real User Monitoring (RUM) offers a robust way to track mobile app performance by capturing data from actual user interactions. Unlike synthetic monitoring, which relies on simulated behavior, RUM provides a genuine look into how your app performs across various devices, networks, and usage scenarios.
Real-time Monitoring Capabilities
New Relic uses real user data to deliver detailed, real-time insights into app performance. It offers full visibility into Android, iOS, and hybrid applications, pinpointing bottlenecks caused by servers, networks, devices, or code issues. With end-to-end performance tracking, the platform identifies errors, monitors app throughput, and provides distributed tracing for both iOS and Android apps. This code-level visibility helps uncover performance problems that might otherwise go unnoticed .
Key features include tracking critical issues like crashes, delayed UI loading, and Application Not Responding (ANR) errors. The user journey tool maps out every interaction leading up to a crash, simplifying troubleshooting. Another standout capability is offline telemetry retention, which stores data locally when users lose connectivity and uploads it once the connection is restored, ensuring no critical data is lost.
Scalability for Large User Bases
As your app grows, New Relic Mobile Monitoring scales effortlessly to handle increasing user activity and data volumes. Whether you’re managing a small project or a large-scale application, the platform adapts without sacrificing performance. It can ingest unlimited data from all telemetry sources, helping teams resolve issues faster by eliminating blind spots.
New Relic’s widespread adoption speaks to its reliability. For example, its browser monitoring solution is used on over 2.78 million live websites. This scalability is further supported by seamless integration with various mobile and cloud ecosystems, making it a versatile choice for diverse application needs.
Chamod Lakmal, Senior Software Engineer at PickMe, highlighted the impact of New Relic’s mobile monitoring in May 2025:
"By integrating New Relic mobile monitoring, PickMe not only gained visibility into their app’s performance but also empowered their team to deliver a better and more reliable app experience to users."
Integration with Mobile and Cloud Ecosystems
New Relic integrates with over 780 cloud services, open-source tools, and enterprise technologies. Its platform-specific agents for mobile apps gather valuable data from user interactions across frameworks like Android, iOS, React Native, Capacitor, Cordova, and Flutter.
Lee Robinson, Vercel Vice President of Developer Experience, shared his thoughts on the partnership:
"Partnering with New Relic, and building on open standards like OpenTelemetry, significantly amplifies the capabilities for easier collection, seamless instrumentation, and comprehensive monitoring of serverless applications, including making this process easier for popular frontend frameworks like Next.js."
By correlating backend and frontend data, the platform helps teams quickly identify and resolve performance issues. This approach aligns with industry expectations, as many organizations aim to establish strong observability practices by 2025.
Proactive Issue Detection and Prevention
New Relic Mobile excels at catching performance problems before they affect users. For instance, it flags Android vitals like excessive app startup times – 5 seconds for cold starts and 1.5 seconds for hot starts. To maintain optimal performance, teams are encouraged to use clear naming conventions (e.g., ‘OS-Type: AppName – Environment’) and keep agents updated.
For crash analysis, the platform supports symbolication of crash reports using dSYM files for iOS or Proguard/Dexguard mapping files for Android, making them easier to interpret. It also provides tools like the HTTP requests page to diagnose third-party performance issues and custom event tracking to monitor specific user activities. Features like crash event trails and breadcrumb events offer a detailed view of user actions leading up to a crash, enabling more precise fixes.
3. Sentry Mobile Error Tracking
Sentry Mobile Error Tracking provides a powerful way to detect and address errors across various mobile platforms. With more than 1.3 million users worldwide and adoption by over 100,000 organizations, Sentry has established itself as a trusted solution for managing mobile application errors.
Real-time Monitoring Capabilities
Sentry keeps teams informed in real time by automatically capturing errors along with detailed context – such as stack traces, device and OS specifics, and user data – helping to reduce detection times significantly. The Crash-Report Modal feature allows users to submit feedback after an error occurs, combining this input with the original event to provide deeper insights for debugging.
Teams can also make use of Sentry’s SDK to log custom events, report errors explicitly, and include personalized messages, enabling more targeted troubleshooting. This comprehensive error capture is the backbone of Sentry’s scalable and integrative framework.
Built for Scalability
Sentry is designed to meet the demands of high-traffic mobile apps, with an infrastructure capable of handling millions of events daily without compromising performance or reliability. Its scalable design supports multiple teams, projects, and access configurations, making it an excellent choice for complex development environments. Sentry works seamlessly with native frameworks like Android and iOS, as well as cross-platform frameworks such as Flutter, React Native, .NET MAUI, and Unity.
For example, Popsa, a photo printing app, saw significant operational improvements after adopting Sentry. In 2020, the team implemented Sentry’s Release Health beta, and Co-founder and CTO Tom Cohen highlighted the impact:
"Release Health is a game-changer for us. Being able to detect bad releases quickly and track crash-free users over time helps us move faster as a team and lets us solve what matters most to our customers. Sentry is a must-have when building and maintaining mobile applications."
Seamless Integration with Tools and Platforms
Sentry connects effortlessly with popular collaboration and version control tools like Slack, Jira, and GitHub, streamlining the issue resolution process. These integrations allow teams to automatically create tickets, send notifications, and link errors to specific code commits. Additionally, integration with version control systems and CI/CD pipelines offers real-time insights into deployment health, ensuring smoother releases.
More than 20,000 mobile teams depend on Sentry to monitor stability and performance.
Proactive Issue Management
Sentry goes beyond error detection by helping teams prevent small issues from escalating into larger problems. Automated error grouping and custom alerts help reduce notification overload and ensure related errors are categorized effectively. The platform’s release tracking keeps an eye on new app versions, flagging increases in error rates or performance drops so teams can address issues early. Feature flag integration further enhances debugging by allowing developers to tag events with relevant data.
Major brands rely on Sentry to maintain their service quality. For instance, Disney+ uses Sentry to deliver a seamless experience to millions of subscribers worldwide, while Rootly deploys updates 10–20 times a day, with Sentry pinpointing issues down to the exact commit or line of code. This precision has cut their fix times from hours to just minutes.
sbb-itb-7af2948
4. Dynatrace Automatic Cloud Orchestration
Dynatrace Automatic Cloud Orchestration brings AI-driven automation and comprehensive visibility to the table, making it a powerful tool for managing hyper-scalable mobile apps. With native apps dominating 90% of mobile device usage and 71% of app uninstalls linked to crashes, Dynatrace addresses these critical pain points with intelligent monitoring and proactive solutions.
While it shares some features with other monitoring tools, Dynatrace sets itself apart with automated instrumentation and AI-powered insights, making it an essential ally for app performance management.
Real-time Monitoring Capabilities
Dynatrace OneAgent captures an impressive 1,000+ PurePaths per minute for each process, delivering unparalleled visibility into mobile app performance. Its automatic instrumentation seamlessly supports Android, iOS, and multi-platform frameworks like Flutter and React Native.
Christian Heckelmann, Senior Systems Engineer at Clario, shared his experience:
"We were able to deploy Dynatrace within minutes, and were amazed by how much comprehensive insights we gained immediately. It’s nothing we’ve ever seen in any other platform."
Scalability for Large User Bases
Dynatrace is built to grow with your app. Its cloud-native architecture scales effortlessly, handling deployments of over 100,000 hosts while maintaining consistent accuracy and performance . Whether you’re running SaaS or on-premises, Dynatrace ensures your monitoring capabilities expand alongside your user base.
Integration with Mobile and Cloud Ecosystems
Dynatrace integrates smoothly with leading cloud platforms like AWS, Azure, and Google Cloud, offering deep insights into the infrastructure supporting your mobile apps . The OneAgent automatically discovers processes and maps dependencies within the tech stack, while its native Azure integration simplifies onboarding and metric collection.
The platform also connects with DevOps and CI/CD pipelines, accelerating testing and deployment workflows. For instance, Inetum-Realdolmen reported faster delivery and reduced manual evaluation efforts thanks to Dynatrace’s seamless integration. By bridging mobile and cloud ecosystems, Dynatrace enables proactive optimization and smoother operations.
Proactive Issue Detection and Prevention
At the heart of Dynatrace’s capabilities is Davis AI, which analyzes trillions of events daily to predict and prevent incidents before they occur . Its AI even generates Kubernetes deployment resources that automatically adjust resource limits based on real-time usage, pushing beyond the boundaries of traditional monitoring.
Bernd Greifeneder, CTO at Dynatrace, captured this shift:
"The shift from reactive to preventive operations represents the next evolution in AIOps. With further additions to our advanced AI capabilities, we believe Dynatrace is cementing its leadership as an intelligent, problem-solving partner for our global enterprise customers."
This proactive approach has delivered tangible results. For example, Mitchells & Butlers saw their order-at-table mobile app drive up to 20% higher order values compared to traditional bar ordering, thanks to reduced customer friction and enhanced digital experiences.
5. Raygun Anomaly Detection
Raygun adds another layer to your monitoring toolkit, complementing Dynatrace’s AI-driven orchestration with its precise anomaly detection capabilities. This tool wraps up our list with its strong focus on error monitoring and performance tracking. With 53% of users abandoning apps due to crashes, freezes, or errors, Raygun addresses these critical challenges head-on, ensuring your app’s success doesn’t hinge on avoidable issues.
What makes Raygun stand out is its ability to drastically cut errors in processes like checkout by as much as 90%, leading to higher revenue and user retention. By combining error tracking, performance monitoring, and user experience analysis into one platform, it ensures your app remains reliable and available.
Real-time Monitoring Capabilities
Raygun excels in real-time error tracking, offering instant notifications equipped with detailed context for identifying root causes. Its diagnostic dashboard continuously monitors system health, making issue detection swift and actionable.
David Corbett, Senior Engineering Manager at Pushpay, highlights its value:
"Raygun gives us the ability to know about issues so we can respond quickly and give our customers the best experience that they deserve and expect."
The platform is particularly effective in tracking JavaScript errors, performance hiccups, and user experience metrics, ensuring zero downtime for your users. For mobile applications, it provides robust monitoring for both iOS and Android, allowing developers to keep tabs on crashes, performance issues, and errors specific to mobile devices.
Raygun’s Application Performance Monitoring (APM) tool goes further by tracking API health, server performance, and database efficiency. This includes monitoring request-response times, server loads, and query performance – offering immediate feedback on errors and bottlenecks for streamlined development workflows.
Scalability for Large User Bases
Handling billions of data points daily, Raygun is built to scale, with usage-based pricing that adapts to your needs . Its spike protection feature limits error volumes to five times the historical average during sudden surges, ensuring system stability.
Raygun’s own development journey highlights its focus on scalability. By switching from Node.js to .NET Core, the platform increased its throughput by an impressive 2,000% while cutting its memory usage from 1GB to just 400MB. Customers benefit from this efficiency too – MMO Age of Ascent, for example, saw a 2,300% boost in requests processed per second after adopting similar optimizations.
John-Daniel Trask, Raygun’s Co-Founder & CEO, emphasizes:
"Performance is absolutely a feature. We know the better performance we deliver, the happier we make our customers, and the more efficient we can run our infrastructure."
The platform’s pricing starts at $4 per month for 10,000 error events in Crash Reporting, and $8 per month for 10,000 traces or sessions in APM and Real User Monitoring, making it an affordable option for growing apps.
Integration with Mobile and Cloud Ecosystems
Raygun supports a wide range of frameworks and platforms, including JavaScript, Angular, Xamarin, React, iOS, and Android. It also integrates with popular development tools like Slack, GitHub, Jira, Bitbucket, and PagerDuty .
For cloud environments, Raygun works seamlessly with AWS and Azure, helping implement dynamic scaling strategies. AWS Auto Scaling, for instance, uses Raygun’s real-time performance data to determine when to scale EC2 instances, while Azure Scale Sets rely on it to monitor individual VM instances for scaling decisions.
Jeb Baugh, Senior Engineering Manager at Praeses, describes their partnership with Raygun:
"We see Raygun as an extension of our team and our company."
Additionally, the platform integrates with load balancers like AWS Elastic Load Balancing and NGINX, offering a complete view of your infrastructure stack.
Proactive Issue Detection and Prevention
Raygun’s anomaly detection features let you set custom alert thresholds with intelligent grouping. For example, you can configure alerts for metrics like more than five JavaScript errors per minute, page load times exceeding three seconds, API response times over 500 ms, or mobile crashes surpassing two per 1,000 users.
The platform also provides rule-based detection for common issues, such as N+1 queries or overused APIs. Developers can use custom tags and context data to quickly identify, reproduce, and resolve problems.
For database performance, Raygun allows you to set execution time thresholds and sends alerts when queries take longer than one second. It also monitors server resources like CPU and memory usage, notifying you when critical levels are reached that could affect user experience.
This centralized monitoring approach is particularly effective for complex, distributed systems, enabling developers to resolve issues quickly across all services while minimizing downtime. For apps scaling rapidly, Raygun’s proactive detection ensures performance remains steady even during periods of intense growth. These features cement Raygun as a vital tool in the performance monitoring lineup, setting the stage for a broader comparison of solutions.
Tool Comparison Table
Here’s a quick breakdown of the standout features and differences among these tools to help you make an informed decision:
| Tool | Setup Complexity | Ideal For | Scalability Features | Entry Price | Key Strength |
|---|---|---|---|---|---|
| Datadog Mobile Monitoring | Medium | Full-stack monitoring across web and mobile | Auto-scaling dashboards, unlimited custom metrics | $15/host/month | Unified infrastructure and application monitoring |
| New Relic Mobile RUM | Medium | Real user experience tracking | Dynamic baseline alerts, distributed tracing | $25/100GB/month | Strong error tracking capabilities |
| Sentry Mobile Error Tracking | Low | Crash categorization and error analysis | Performance monitoring integration, custom workflows | $26/month (team plan) | Actionable crash insights with full context |
| Dynatrace Auto Cloud Orchestration | Low | AI-driven automated monitoring | OneAgent auto-discovery, cloud-native scaling | $69/month (8GB host) | Automated setup with minimal manual configuration |
| Raygun Anomaly Detection | Low | Proactive issue detection and prevention | – | $4/month (10K events) | Real-time anomaly detection with custom thresholds |
Both Dynatrace and Raygun stand out for their low-complexity setups, making them ideal for teams seeking quick deployment with minimal hassle. They also support major frameworks like native iOS, Android, React Native, Xamarin, and Flutter.
When it comes to scalability, the tools take different approaches. Datadog offers unlimited custom metrics and auto-scaling dashboards, while New Relic adapts to growth with dynamic baseline alerts.
Entry pricing varies widely, reflecting the tools’ target audiences. Raygun provides an affordable option with its $4/month plan, while Dynatrace caters to those needing advanced AI-driven automation at a higher price point.
Ultimately, the best choice depends on your specific needs. If you’re managing complex, distributed systems and want a hands-off setup, Dynatrace is a strong contender. For teams aiming to reduce crashes and improve error tracking, Sentry delivers excellent tools for categorization and analysis. And if real-time anomaly detection is a priority for your scalable mobile app, Raygun offers fast, customizable alerts.
Conclusion
Selecting the right monitoring tools is essential for protecting the user experience and supporting your business’s growth. With 53% of users abandoning apps that crash, freeze, or encounter errors, the stakes couldn’t be higher.
"Users expect apps to be free of bugs and stable." – Anushka Mukherjee
To start, focus on the basics: crash reporting and user experience monitoring. These tools address the most pressing issue – instability that drives users away. Ideally, your app’s crash rate should stay below 1% per user.
Tools like Sentry for crash reporting and New Relic’s Mobile RUM for tracking user experience provide immediate insights. As your app scales, you can expand your toolkit with solutions like Datadog for infrastructure monitoring and Dynatrace or Raygun for predictive analytics.
Take Netflix as an example. They began with simple monitoring and gradually adopted dynamic scaling through AWS Auto Scaling. This approach highlights how carefully integrating tools over time can significantly enhance performance.
The key is focusing on actionable metrics that directly influence user satisfaction – think CPU usage, error rates, response times, and real user feedback. Custom alerts based on performance thresholds can help you stay ahead of potential issues, while regular crash report reviews allow you to spot patterns before they escalate.
From real-time crash tracking to AI-powered automation, the right mix of tools ensures a strong monitoring strategy. The tools we’ve discussed equip you to monitor, maintain, and scale your app effectively. Start with what fits your current needs, but always keep an eye on future growth. Your users – and your business – will thank you.
FAQs
How can I choose the best monitoring tool for my hyper-scalable mobile app?
Choosing the right monitoring tool for your hyper-scalable mobile app begins with understanding your app’s specific needs. Focus on areas like performance tracking, user analytics, crash reporting, server monitoring, and real-time issue detection. The tool you select should align closely with these priorities and be capable of scaling to meet increasing user demands.
Key features to look for include automated alerts to keep you informed, seamless integration with your current systems, and customizable dashboards to simplify workflows. Make use of demos or free trials whenever possible to see how a tool performs in your app’s environment. Opting for a solution that evolves alongside your app will help maintain smooth performance and deliver a consistently great user experience as your audience grows.
What are the main advantages of using AI-powered tools like Dynatrace for monitoring mobile app performance?
AI-powered monitoring tools like Dynatrace bring a host of benefits to managing mobile app performance. They provide real-time insights into how your app is performing and the experience users are having, making it easier to spot and fix problems as they happen.
Another standout feature is their ability to perform automated root cause analysis. This means they can quickly pinpoint what’s causing performance issues, helping you resolve them faster and keep your app running smoothly.
These tools also improve visibility across the entire app stack – from the front-end interface users interact with to the back-end systems powering your app. This ensures that no part of your app’s performance goes unchecked. Plus, they help developers refine the user experience by analyzing how users interact with the app and identifying areas for improvement.
Finally, these solutions are built to handle scalability, so your app can maintain top-notch performance even as your user base grows.
How does real-time monitoring enhance app performance and help retain users?
Real-time monitoring is essential for keeping apps running smoothly and ensuring users stick around. It allows developers to spot and fix problems like crashes, slow loading screens, or other hiccups as they happen. These kinds of issues can frustrate users, and too many of them might even push people to uninstall the app.
By resolving such problems quickly, developers can deliver a more seamless and dependable experience. This not only keeps users happy but also builds their trust in the app. On top of that, real-time data gives developers a better understanding of how people are using the app. With these insights, they can tweak features or make updates that align with user behavior and preferences – an edge that’s crucial in today’s competitive app market.